Friday, October 21, 2011

2011 and Pitcher Recap

,
I wanted to see how well the starting pitchers did during the games I went to.  However, the W/L does not mean the SP necessarily picked up the Win or Loss.  It refers to the final result for the game.  As you can see, the Mariners scored only 1 freaking run in Fister's 3 starts.  Poor guy, I'm sure he's feeling much better in Detroit.

Let's compare run support.  Fister, as I stated, only had 1 run scored for him in three games, or .33 runs per game.  That's definitely at the bottom.  Bedard, traded to Boston, was given 4 runs in three games, 1.33/game.  Furbush, Vasquez, and Pineda were all even at 2.3/game.  Felix was 2.89/game, and Vargas 3.22/game.  The man with the most support was Beavan at 3.6/game.  If you take out the first game Felix pitched, the historic come from behind win, then the Mariners only scored 2 runs per game in which he started!!

To the side you will find the SP ranked from lowest to highest ERA.  This isn't the best gauge always, but is a good indication on how their totals compared.  Then I decided to take out the "outliers".  That is, a game in which they just weren't as sharp as usual.  I only did this on pitchers who had 5 or more starts, 'cause it enabled me to see trends more easily.  I removed the 4/8 game for Vargas, 4/11 game for Felix, 8/15 for Pineda and 9/27 for Beavan.  We had a 2-2 record in those games.

It looks like the top two starting pitchers duking it out are Felix and Pineda.  They are pretty even in all categories, if only Pineda had 3 more starts then it would have been really easy to pick the top guy.  Statistics wise, Pineda not only tops Felix in ERA, but also in run support, strikeouts per 9 innings (9.44 vs 8.97), and Strikeout/Walk Ratio (4.1 vs 3.58), and Walks & Hits per Inning Pitched (.95 vs 1.06).  But Felix did last deeper into the games, and like I said he had 3 more starts.  Some of the stats could have something to do with the fact that he was a rookie.  They tried not to push his innings too far, and a lot of the teams did not have scouting on him.  Felix won the Cy Young last year, he had a lot of people gunning for him.  Ask me who I want on the mound and I would pick Felix over Pineda any day.  Felix is proven, Pineda still has a few more years to develop.


It was much harder for me to compare the hitters.  We had so many injuries and roster moves that I was only able to find 6 players with at least 100 plate appearances over those 41 games: Ichiro, Olivo, Ryan, Ackley, Smoak, and Kennedy.  Carp was just under at 91 PA.  The result?  They were pretty much pathetic!  I don't know how many more ways I can prove that our offense sucked this year. 

Below you see our team hitting organized by month.  April and August were our best months, followed by May.  Remember, this is only with the top seven players mentioned above.  Doing the whole team would have been too large of a project.

Team batting by month, combining Ackley, Carp, Ichiro, Kennedy, Olivo, Smoak, and Ryan
Overall, not good at all. No single player has ever had that many plate appearances in a season.  But let's ignore that part.  Even if this had been a regular season length, 17 homers with 63rbi could be seen as a pretty poor season, akin to the seventh man in the lineup.  The .216 batting average is terrible, the 191 strikeouts vs 66 walks is horrible.  That's 2.89 (nearly 3) per walk.  We struck out 23% of our plate appearances. 

The tables above compare the 7 players.  The first organizes by On Base Percentage, Batting Average, and finally by plate appearances.  I was surprised to see how low Ackley's BA was, it seemed like every time I saw him he got a hit, or at least got on base.  I'm excited to see what he brings over a full 162 games next year.  In general I care more for On Base Percentage than Batting Average.  A good batter will have an OBP of at least 75 points higher than their BA.   A great one will be 100 or more above.  For the seven players, here is how they ranked:
  1. Smoak (.116)
  2. Ackley (.113)
  3. Ryan (.082)
  4. Olivo (.051)
  5. Carp (.051)
  6. Ichiro (.042)
  7. Kennedy (.027)
I also like extra base hits.  I like them because if you have someone on, they are more likely to score!  I like them because the only way you can score in baseball is if your runner gets around the bases.  The faster they move from base to base, the less work the player behind them has to do.  If you leadoff the inning with a double, you can get two productive outs and score the runner without a base hit.  So, here are the players listed by the percent of their hits being extra bases.  For the team it was .067, just below the "good" threshold.
  1. Smoak (61.90%)
  2. Carp (47.37%)
  3. Olivo (41.18%)
  4. Ackley (36.84%)
  5. Kennedy (33.33%)
  6. Ichiro (20.51%)
  7. Ryan (13.04%)
Ryan isn't really surprising, he went a really long time without an extra base hit to start the season.  OlivoSmoak's and Carp's numbers can probably be partially attributed to their lack of games played.  Overall, the "team" percentage was 34%.

Finally. let's look at the Strikeouts per Walk ratio.  The lower, the better.   As stated above, the team ratio was 2.89:1
  1. Ackley (1.71:1)
  2. Smoak (2.00:1)
  3. Ryan (2.50:1)
  4. Ichiro (2.86:1)
  5. Carp (4.67:1)
  6. Kennedy (6.67:1)
  7. Olivo (8.00:1)
I like RBI almost more than I love extra base hits, 'cause I don't care how we get them!  Let's compare the leaders in the percentage of time a plate appearance led to an RBI.  It may not exactly be fair because the meat of your order is generally who will produce your most runs.  So, it isn't surprising that Ichiro and Ryan are near the bottom.  Olivo hit in the 3/4/5 spots most of the year, and he should be higher.  Kennedy is the real surprise.
  1. Carp (13.19%)
  2. Smoak (11.32%)
  3. Kennedy (9.00%)
  4. Ackley (7.92%)
  5. Ichiro (6.29%)
  6. Olivo (5.22%)
  7. Ryan (3.23%)
Now, if we "weigh" all the leaders in the categories I talked about above, here is a list of the top batters for the year.  There are 7 categories: OBP, BAA, PA, BAA above OBP, XBH%, BB/K, and RBI %. 
  1. Smoak
  2. Ackley
  3. Ichiro
  4. Carp
  5. Ryan
  6. Kennedy
  7. Olivo
The top two hitters were Ackley and Smoak.  I was surprised to see Ichiro that high, although that is attributed to being first in plate appearances and second in batting average.  He was second to last in two categories and smack dab in the middle for the other one.  Olivo was at the bottom, and we got him for his bat, 'cause his defense sure sucks.  I'm hoping we either pick up a new catcher, or Adam Moore stays healthy.

Well, that's it.  That wraps up 2011.  I'm sure I could spend months digesting and regurgitating different statistics but I think this will suffice.  2012 is right around the corner, and our kids are going to deliver (or heads will roll).

Saturday, October 8, 2011

End of Year Recap

 I ended up going to exactly half of the home games, if you include the away games we played against the Marlins.  I ran short of my goal, but this was due to missing around a month because of my back injury.  From the statistics I compiled, I pretty much proved that if the Mariners scored more than 4 runs, they would win.  Their record was 12-1 when they scored more than 4 runs, which means they won 92% of the time!!!   Unfortunately, it seemed a little too difficult for them to score that many.

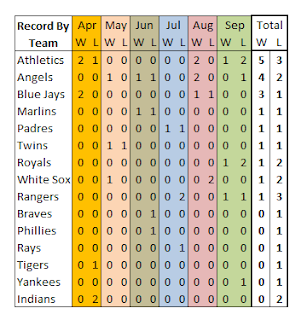
Mariners Record By Team Played
As you can see from the stats, I saw the Mariners play 15 different teams, 4 NL and 11 AL teams.  Since there are 14 in the American League, I only missed 2: Baltimore, and Boston.  Our record in Inter-league games was 2-4.  It isn't surprising that the top two teams I saw most frequently were from our division.  Nearly 20% of the time I hit Safeco I had the pleasure of seeing the green and gold of the Athletics, but that is helped by our positive record (5-3).  I was a little surprised that I saw the Rangers as many times as the Blue Jays, but maybe that is a good thing (1-3).

Now I will show a game of all game results organized by date played.  I will do another post on individual batter/pitcher statistics, although that is turning into a bigger venture than I thought!.  As you can see by the chart below, losses are in red and wins in black.  There are so many different ways I can rank/calculate, the options are endless and I could do 15 posts about it.  But I won't, at least for now.

The Greatest Loss was on Opening Night, as we lost by 9 runs to Cleveland.  Our Largest Win was July 1st (Game 19) against San Diego.  Interesting that the Starting Pitcher both games was Jason Vargas. 

Average attendance per game I attended was 22,798.  The capacity of Safeco Field is over 45,000.  The average time of game was 2:41.  The shortest game of the year (Game 34) clocked in at 2:04, and the longest was the historic comeback in Game 3 at 3:46.

The smallest crowd of 12,770 for Game 6 was only 4 tickets above the second smallest (Game 5).

From the table at the top of the page as well as to the left, you can see our pathetic run totals.  We scored 1 or fewer runs in 15 games.  That is over a third of all games I went to!  We won only 1 of those (Game 5), the lowest attended game of the year, and were shut out in 6 of them.  At least we threw 5 of our own!

The absolute worst day to go was Saturday. I find it hard to believe that we lost every single Saturday game I went to! But the stats don't lie, they were 0-9.  That can't be a coincidence.  It will be interesting to see if I find a similar result in 2012

I'm glad I compiled all these, it will be interesting to look for patterns year after year.


Saturday, October 1, 2011

September Games Recap

The final month of the season wrapped up poorly.  I didn't keep track of food the final games, but that ended up being too hard to keep track of anyway so I won't do again next year.

Thu 9/1 LAA L 4-3, Furbush,  Baked Potato, scored, 19,453
Thu 9/8 KC W 4-2, Vargas, Pizza, scored, 14,473
Sat 9/10 KC L 4-2, Pineda, Torta, scored, 17,883
Sun 9/11 KC L 2-1, Vasquez, Cafe, scored, 20,951
Tue 9/13 NYY L 3-2, Furbush, Burger, scored, 18,306
Fri 9/16 TEX W 4-0, Beavan, scored, 17,607
Sat 9/17 TEX L 7-6, Vasquez, scored, ROOF, 22,159
Mon 9/26 OAK W 4-2, Vargas, scored, ROOF, 17,507
Tue 9/27 OAK L 7-0, Beavan, scored, 18,600
Wed 9/28 OAK L 2-0, Vasquez, scored, 20,173

Record by Starting Pitcher
Felix: N/A (6-3)
Pineda: 0-1 (4-2)
Vargas: 2-0 (3-6)
Beavan: 1-1 (3-2)
Furbush: 0-2 (0-3)
Vasquez: 0-3 (0-3)
Fister: N/A (0-3)
Bedard: N/A (1-2)

Record by Day (Overall)
Mon: 1-0 (6-3)
Tue: 0-2 (2-3)
Wed: 0-1 (3-2)
Thu: 1-1 (2-1)
Fri: 1-0 (5-4)
Sat: 0-2 (0-9)
Sun: 0-1 (0-1)

Record By Food
Baked Potato: 1-0 (2-1)
Cookies: N/A (1-1)
Pizza:  1-0 (4-1)
Gyro: N/A (3-2)
Garlic Chicken N/A (2-2)
Garlic Fries: N/A (1-1)
Kettle Corn: N/A (3-2)
Crepe: N/A (2-3)
Brisket Sandwich: N/A (1-1) 
Burger: 0-1 (0-2)
Cafe: 0-1 (0-1)
Torta: 0-1 (1-1)

Record with Roof Closed: 1-1 (3-3)
Record while Scoring: 3-7 (10-17)

Attendance:
Mon: 17,057;
Tue: 18,306; 18,600
Wed: 20,173
Thu: 19,453; 14,473
Fri: 17,607
Sat: 17,884; 22,159
Sun: 20,951
Avg Attendance:  18,666 (21,953)

Overall Score:  Opponent 33 (135) Mariners 26 (121)
Run Differential: -7 (-14)

Avg Runs Scored
Mariners 2.6
Opponent 3.33

Greatest Run Differential Win: 4
Greatest Run Differential Loss:7

Mariners total Runs Record:
0: 0-2 (0-6)
1: 0-1 (1-8)
2: 0-2 (1-4)
3: 0-1 (4-4)
4: 3-0 (5-0)
5:       (3-0)
6: 0-1 (2-1)
8:       (2-0)

Opponent:
0: 1-0 (5-0)
1:       (2-1)
2: 2-2 (7-4)
3: 0-1 (1-3)
4: 0-2 (1-5)
5:       (1-3)
6:       (0-1)
7: 0-2 (1-2)
8:       (0-2)
9:       (0-1)
12:     (0-1)

Overall 3-7 (18-23)
One Run Games: 0-4 (6-7)